Data quality at Prolific - Part 2: Naivety and Engagement

It's time for Part 2 of our data quality miniseries!
This time, we are diving deeper into participant "naivety" and engagement, looking at the measures we have for each and how our pool currently fares on those measures.
We'll also discuss the techniques we have for managing for naivety and engagement, and our plans for improving them in the future!
If you missed our previous post, where we set out the general framework for data quality at Prolific, please do check it out here!
What does it mean to be a "naive" participant?
As we said last time, certain types of research depend strongly on participant naivety in order to obtain truthful or meaningful results. Often, this is related to the extent to which participants can guess at the research question, or recognise common experimental measures or manipulations. If they do so, their responses might become biased.😬
You can, in principle, categorize participant naivety into several different types (topic naivety, experimental naivety, research question naivety, etc), but to keep it simple, we'll think of it as 'exposure to research' for the time being.
Since Prolific is a platform dedicated to online research, and a place where people specifically come to take part in research, we are acutely aware that our participants are not the most naive bunch out there!
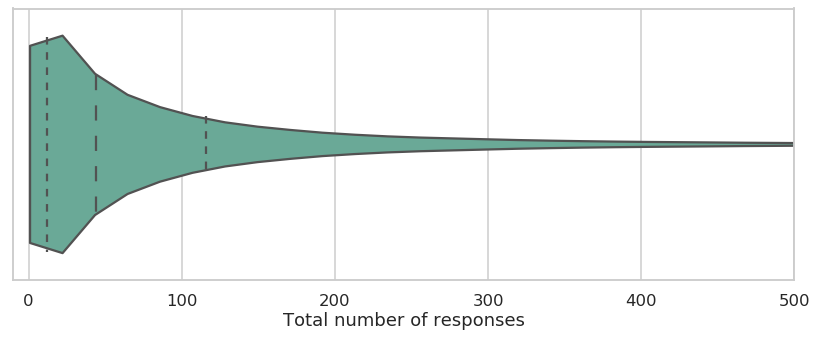
For example, the graph below shows that 50% of participants who've completed a study on Prolific in the last 90 days have submitted 44 responses or more in their lifetime.

This violin plot shows the distribution of "total number of responses" among participants who've completed a study on the site in the last 90 days. Dotted lines show quartiles. Please note, these data were collated in December 2019.
In the past week, the most active 5% of participants completed 20% of the responses on Prolific. This isn't quite the fair distribution of studies that we're aiming for, but it could be worse: on MTurk, the top 5% complete 40% of available HITs (see here)!😬
When it comes to distributing studies evenly, our primary tool is something called adaptive rate limiting. In essence, when the number of active participants is high relative to the number of study places available, we give priority access to participants who've spent less time taking studies recently. When studies are filling particularly slowly, we then loosen the limits and let our more 'prolific' 😜 survey takers work their magic.
This mechanism gives us several parameters we can tweak in order to distribute studies more fairly and restrict the number of "professional survey takers" on the platform. By increasing the limit, we reduce the rate at which a participant becomes non-naive, but the catch is that this accordingly slows down data collection.
The art of maintaining a healthy balance between participant naivety and data collection time is a tricky one, and we are working hard on improving this aspect!
We are currently developing plans to recruit more participants who don't normally take online surveys, and we'll supplement this by distributing studies more fairly and providing better study notifications.
The hope is that, with some more work, we can create a better experience for the average participant and a better spread of participant naivety for researchers.🤞
What does it mean to be an "engaged" participant?
The word engaged or engagement can be tricky to define (trust us, one of us did a whole PhD on it #noregrets), but in the context of the NEAT framework, we think of engaged participants as being motivated and thoughtful.
We are sure you can imagine a whole range of ways to measure these participant qualities in your online research. As we've said before, we think a good differentiator of engaged vs. unengaged participants is the length and quality of free-text answers they provide. A highly engaged participant might write several, well thought-out sentences in answer to your questions, whereas a poorly engaged participant might only write a few words.
In fact, we think this is such a good measure of engagement that we use it in almost all the audit surveys we run on Prolific! We recommend all researchers include a free-text question in every survey you run.👌
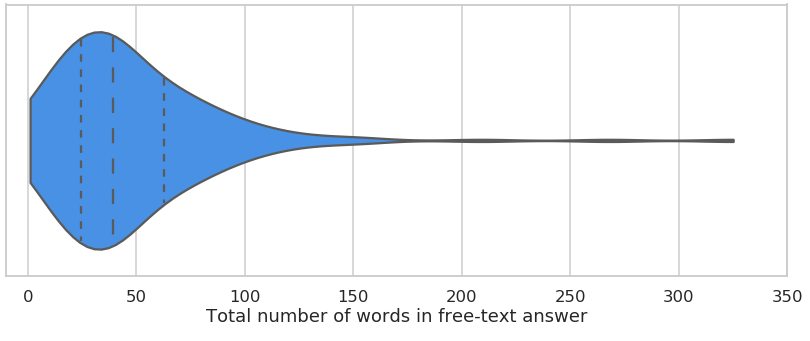
To give you a sense of how engaged our participants are, the graph below shows the average length of free-text responses we received in an 10-minute survey where we asked participants for ideas on how to make Prolific as big as possible (now THAT'S crowdsourcing 😉).

Distribution of answer length from a recent 10-minute survey (£6per/hr) which asked for ideas of how we could grow Prolific.
Did you know that participants on Prolific are highly engaged (as denoted by great retention rate) in multi-part studies? That's another piece of evidence pointing to the level of participant engagement on our platform.👇
To be precise, a recent analysis of dropouts in over 2000 multipart / longitudinal studies run on Prolific in the last two years showed mean retention between study-parts to be 86.2% (95% CI 85.8 - 86.8).🎉
All that said, a participant's 'trait' engagement is not the only factor that influences the amount of effort they're willing to put into your study. There's also a ton of research into factors influencing motivation on crowdsourcing platforms. For example, this paper shows that higher participant rewards increase perceived fairness of pay and boost performance, and this paper shows that other factors such as task autonomy, and skill variety required can also increase motivation and therefore data quality!
The bottom line is this: We are doing our best in ensuring that participants on Prolific are highly engaged, but the design of your study also plays a big role in participant motivation.
In other words, pay fairly, make your research as interesting as possible and pilot, pilot, pilot to fix bugs and usability issues! 🛠
That's it for this part of our Data Quality miniseries.
Do you have best practices suggestions for managing participant naivety and engagement? Let us know! 🙏
Next time, we'll talk about the final two aspects of the NEAT framework: Attentiveness and Trustworthiness, and how we use a combination of human monitoring and Machine Learning to stay on top of the game. As always, stay tuned!
Cheers,
Prolific Team
Come discuss this blog post with our community!


